
Plotting and Solving
When approaching a situation that requires a solution or graph of an equation, there are numerous strategies that can be used.
The first is a manual method, which uses a table of values.
Another approach is to use graphing technology, which could include a graphics calculator, basic software like Microsoft Excel or specialised software like GeoGebra.
Table of Values
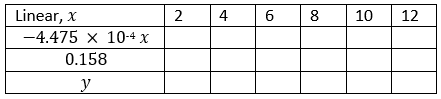
This linear function reflects the change in Blood Oxygen Concentration with an increase in Exercise.
Solve the following equation, using a table of values:



Exponentials
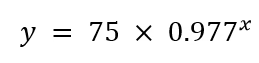
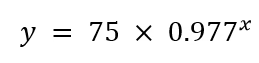
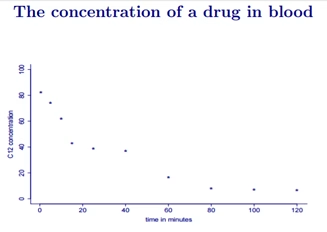
This exponential decay function reflects the concentration of a drug in blood, 12 hours after dosing.
Solve the following equation, using a table of values:


The Context
The two equations that you plotted relate to blood and physiology.
The linear function reflects the change in Blood Oxygen Concentration with an increase in Exercise.
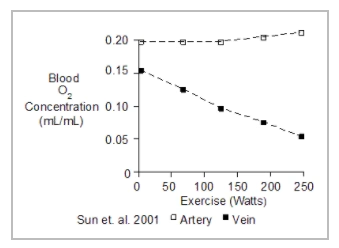
(https://www.umc.edu/Education/Schools/Medicine/Basic_Science/Physiology_and_Biophysics/Core_Facilities(Physiology)/Physical_Exercise_-_Blood_Gases.aspx)
The exponential decay function reflects the concentration of a drug in blood, 12 hours after dosing.
(http://www.math.ku.dk/~susanne/StatDiff/Overheads1.pdf)